
Understanding Free Margin in Trading
📉 Understand free margin in trading: how it affects your funds for new trades and losses. Learn to manage it wisely amidst volatile markets, tailored for South African traders.
Edited By
Liam Robinson
The NAS100, tracking the top 100 non-financial companies listed on the NASDAQ stock exchange, is a major focus for traders both locally and abroad. In South Africa, many investors watch NAS100 signals closely to get clues about possible price shifts and market trends. Understanding these signals is not just about spotting patterns on a chart; it’s about reading what the market sentiment and economic factors suggest.
Signals in the context of the NAS100 often involve price movements, volume changes, or technical indicators that hint at the next possible drift or reversal. For example, a sudden jump in volume alongside a price breakout may signal strong buying interest, prompting traders to consider entering long positions.
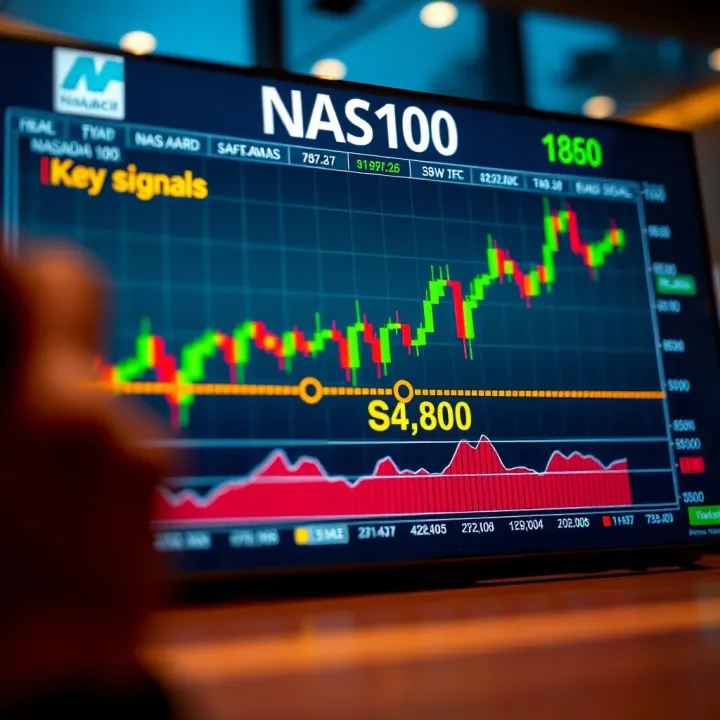
There are several types of NAS100 signals:
Trend signals: These indicate whether the index is moving upward, downward, or sideways. Traders use moving averages or the Average Directional Index (ADX) to gauge trend strength.
Reversal signals: Tools like the Relative Strength Index (RSI) or candlestick patterns (hammer, shooting star) help spot when a trend might reverse.
Volatility signals: Indicators such as the Bollinger Bands reveal when the index price is likely moving into a period of higher or lower volatility.
South African traders often combine these signals with local economic insights or global events affecting tech stocks, such as US interest rate decisions or earnings releases from giants like Apple and Amazon.
Successful trading in NAS100 relies on interpreting these signals within context, not just following them blindly.
Practical application means using signals alongside risk management tools—like stop-loss orders—to protect against sudden market swings. For instance, if the NAS100 breaks below its 200-day moving average with rising volume, that might trigger a cautious exit or hedge strategy.
In this guide, we’ll look at how South African traders make sense of NAS100 signals, what strategies they use, and the pitfalls they watch out for during volatile trading days.
Understanding what NAS100 signals are and how they work is vital for anyone wanting to trade or invest in the NASDAQ 100 index. These signals help traders interpret market movements and make decisions based on patterns, trends, and emerging economic factors. For South African traders especially, grasping these concepts means better timing and risk management in a market that often moves fast and can be influenced by international news.
The NASDAQ 100 (NAS100) is an index listing the 100 largest non-financial companies listed on the NASDAQ stock exchange. It includes giants like Apple, Microsoft, and Tesla, which tend to have considerable influence on the overall index movement. Since it focuses on tech-heavy and innovative companies, the NAS100 often reacts sharply to technology trends and earnings announcements.
For traders, this index offers a concentrated lens on the tech sector's health and innovation trajectory, making it a key market barometer. Understanding the components and sectors within NAS100 helps in assessing which signals might be relevant depending on broader economic or company-specific developments.
Signals act as clues or indicators derived from price movements, volume changes, and other market data. They help anticipate future price direction, signalling when to enter or exit a trade. Rather than guessing, traders using NAS100 signals base their moves on observable market behaviour and data patterns.
These signals cut through noise and give a snapshot of market sentiment or momentum. For instance, a sudden spike in trading volume accompanied by a strong upward price movement could signal a breakout, prompting a trader to act quickly. Without these indicators, decisions would rely more on hunches than on concrete evidence.
Most signals fall into categories like trend signals, momentum signals, and volatility indicators. Trend signals—such as moving averages—help identify the market’s overall direction. Momentum indicators, like the Relative Strength Index (RSI), reveal if the index is overbought or oversold, warning traders of potential reversals.
Volatility measures, for example, Bollinger Bands, show how far price might stray from its average, useful for spotting breakouts or consolidations. Recognising these common types allows traders to build a toolkit tailored to their trading style and goals.
Technical indicators track historical price and volume data to forecast potential future moves. For NAS100, popular indicators include moving averages, RSI, MACD (Moving Average Convergence Divergence), and Bollinger Bands. These tools discreetly highlight changes in trend or momentum often before price swings become obvious.
Applying multiple technical indicators together can give South African traders more confidence. For example, a moving average crossover combined with RSI signalling an oversold condition might suggest a buying opportunity.
Apart from charts, fundamental events like earnings reports, product launches, or macroeconomic announcements (e.g., US interest rate decisions) significantly impact NAS100 signals. These events often cause swift price shifts that technical indicators alone might not predict.
Take the example of Apple’s earnings announcement; a positive surprise can instantly trigger strong buy signals, while disappointing results can cause sharp sell-offs. Traders who monitor these events alongside technical signals often gain a clearer, fuller market picture.
Sentiment derived from news headlines, analyst upgrades/downgrades, and social media chatter influences how traders interpret signals. For instance, widespread optimism about AI technology can push NAS100 higher, reinforcing technical bullish signals.
Conversely, negative global news like geopolitical tensions or economic slowdown fears might weaken signals or create false breakouts. Keeping a finger on the pulse of market sentiment helps traders assess whether signals align with broader market moods or if caution is needed.

Successful NAS100 trading isn't just about reading charts; it involves blending technical data, fundamental news, and market sentiment for well-rounded, timely decisions.
Understanding how to interpret NAS100 signals is essential for making smart trading decisions on the NASDAQ 100 index. These signals help you spot emerging trends, potential reversals, and market conditions, giving you an edge whether you trade short-term or hold longer positions. Getting the hang of common technical indicators and knowing how to combine them can mean the difference between guessing and trading with confidence.
Moving averages smooth out price data to reveal overall market direction. For instance, a 50-day moving average (MA) tracks the average closing price over 50 days. When the NAS100 price crosses above this MA, it signals a possible upward trend; crossing below might suggest a downturn. Traders often watch for “crossovers” between short-term MAs (like 20-day) and long-term MAs (like 50-day) to confirm momentum shifts.
As an example, if the 20-day MA crosses above the 50-day MA—a "golden cross"—it might be a green light to enter a trade. In contrast, the opposite “death cross” warns of a potential decline. These signals can help clarify the prevailing trend amid the NAS100’s regular ups and downs.
The RSI measures momentum, showing when the NAS100 might be overbought or oversold. RSI values above 70 suggest the market has risen too far, too fast, hinting at a pullback. Values below 30 indicate oversold conditions, where prices might rebound.
Traders use RSI to find entry or exit points. For example, if the RSI drops below 30 and then climbs back above it, this may signal a buying opportunity. In volatile markets, relying solely on RSI can be misleading, so it’s wise to confirm with other signals.
Bollinger Bands consist of a moving average plus two bands set a certain number of standard deviations away, capturing volatility. When the NAS100’s price touches or breaks above the upper band, it often signals the asset is overbought. Touching or falling below the lower band suggests oversold territory.
Periods when the bands squeeze tightly indicate low volatility, often preceding big price swings. For instance, after a prolonged squeeze, a breakout above the upper band can point to a strong upward move. By watching Bollinger Bands, traders gauge when volatility might spike, adjusting risk and opportunities accordingly.
Relying on a single signal can result in false alarms. Combining indicators—like MAs, RSI, and Bollinger Bands—helps validate trades. Say the NAS100 price crosses above the 50-day MA, RSI moves from oversold to neutral, and Bollinger Bands show expanding volatility; this alignment strengthens the case for a buy.
Such cross-verification reduces guesswork, especially in fast-paced markets where noise can cause misleading signals.
Volume confirms the strength behind price moves. A price breakout with high volume tends to be more reliable than one with weak volume. Watching candlestick patterns also adds insight into trader sentiment.
For example, a bullish engulfing candle accompanied by rising volume on NAS100 charts signals increased buying interest. This combination can prompt traders to enter or add to positions.
Not all signals pan out as expected—some are false. Filtering involves ignoring signals that don’t align with broader trends or lack confirmation from other indicators. For instance, an RSI oversold level without supporting price action or volume increase might be a trap.
Keeping an eye on market context—such as upcoming economic events or news—helps avoid being caught off guard. Regularly reviewing and adjusting your signal criteria based on past performance sharpens accuracy over time.
Making sense of NAS100 signals means linking multiple clues together, not just reacting to one alone. This layered approach improves decision-making and lowers unnecessary risks, critical for trading success.
Understanding trading strategies based on NAS100 signals can make a big difference in how you manage your trades. The NASDAQ 100 is known for its volatility and fast moves, so having a clear strategy helps in making informed decisions and managing risks effectively. These strategies fall mainly into short-term and long-term approaches, each suited to different trader profiles and market conditions.
Day trading with intraday signals involves taking advantage of price movements within the same trading day. For example, a trader might use hourly moving averages and RSI (Relative Strength Index) to spot quick entry and exit points. This method demands rapid decision-making and constant monitoring, especially given the NAS100’s tendency to react strongly to news and economic data. A practical case would be a trader capitalising on sudden tech stock earnings releases that cause rapid price shifts.
Scalping techniques take short-term trading even further, aiming for small profits from very quick trades – sometimes lasting just minutes. Traders using NAS100 signals for scalping rely heavily on indicators like Bollinger Bands or very short moving averages to identify brief spikes or dips. This approach suits traders who can act swiftly, as they need to enter and exit multiple trades without letting emotions affect their choices. For instance, during volatile sessions, scalpers can benefit from minor price oscillations driven by large institutional orders.
Timing entry and exit points is critical in short-term trading. Using NAS100 signals like volume spikes combined with price action can help pinpoint when the market is ready to move either up or down. Rather than blindly following one indicator, traders often use a blend, such as waiting for RSI to show oversold conditions alongside a bullish candlestick pattern before buying. Accurately timed trades reduce exposure to unexpected reversals and lock in profits more reliably.
Swing trading with NAS100 signals focuses on capturing price moves over several days or weeks. Traders examine signals such as moving average crossovers or MACD (Moving Average Convergence Divergence) to confirm trend changes. This strategy fits investors who want to hold positions longer than day traders but still seek timely opportunities to trade around market cycles. For example, a swing trader might enter when the 50-day moving average crosses above the 200-day, signalling a potential upward momentum.
Using signals to confirm fundamental analysis blends numbers with market behaviour. Suppose a company in the NASDAQ 100 reports strong quarterly results and raises its earnings forecast. A savvy trader can look to technical signals like breakouts above resistance levels to confirm the positive fundamental news before committing funds. This combination reduces the chance of entering on misleading or temporary market movements.
Risk management in longer trades is vital, even when holding positions for weeks or months. Traders often set stop-loss orders based on signal levels, such as below recent support lines or the 200-day moving average, to protect capital if the trade goes against them. Diversifying across industries within the NAS100 can also help spread risk, especially when certain sectors, like tech or biotech, face sudden swings. Keeping an eye on signal changes ensures timely adjustments to trading plans.
A well-rounded strategy based on NAS100 signals blends technical and fundamental insights, aligns with your trading style, and keeps risk under control — essential for thriving in South Africa’s dynamic market environment.
By knowing when to trade short term or hold long term, and how to interpret specific NAS100 signals, you’ll be better equipped to navigate this popular index effectively.
Trading the NASDAQ 100 index offers great opportunity, but it also comes with significant risks that traders need to manage carefully. Understanding the risks associated with NAS100 signals helps you avoid common traps and protects your capital from sudden market swings. This section highlights pitfalls to watch out for, plus practical steps to reduce your exposure.
One common mistake is placing too much faith in just one technical indicator, like the RSI or moving averages. For instance, an RSI reading might show an overbought condition prompting a sell, but without considering volume or broader trend signals, you might miss a strong momentum push that keeps prices rising. Relying solely on a single signal can lead to premature exits or misguided entries, which eats into profits or compounds losses.
Broad market dynamics often can’t be captured by one indicator, so it's safer to cross-check several signals before making moves. This approach helps filter out noise and confirm if a trend has real strength behind it.
Signals alone don’t tell the whole story. Events like unexpected Federal Reserve announcements, geopolitical tensions, or big company earnings within the NASDAQ 100 can send prices in sharp directions regardless of what indicators suggest. Ignoring these factors means you might hold onto positions blindly as markets react to news.
For example, an investor relying purely on technicals could miss that a sudden US interest rate hike will likely dampen tech stocks, affecting the NAS100. Always keep an eye on economic calendars, global news, and corporate developments alongside signal analysis.
The NASDAQ 100 can be volatile, reacting swiftly to global shocks—like a fuel price surge in the Middle East or a US-China trade dispute flare-up. Sudden shifts can invalidate existing signals or trigger whipsaws, catching traders off guard.
Conditional planning is key. Expect the unexpected and be ready to act fast. For instance, during Eskom load shedding stages impacting South African markets, traders might see abnormal price moves globally. Being alert to such external shocks helps you reconsider your open positions in time.
A stop-loss is your safety net. This order automatically sells your position if it drops to a certain price, limiting losses without waiting for emotion to kick in. For instance, if you buy a NAS100 ETF at R7,000, setting a stop-loss at R6,850 can prevent deeper losses if the index suddenly dips.
Using stop-losses enforces discipline and prevents the common trap of hoping a position will recover when it might keep falling. It also frees you from constantly monitoring your trades.
Putting all your eggs in one basket—say, just a few NAS100 stocks or futures—adds unnecessary risk. Instead, spread capital across different assets or sectors. For South African traders, this might mean mixing NASDAQ index futures with local JSE shares or commodities.
Diversification cushions your portfolio against sector-specific shocks. When one market or stock stumbles badly, others might stay stable or move opposite, smoothing your overall return.
Markets evolve, and so do signal effectiveness. A strategy that thrived during low volatility might crumble when conditions shift. Regularly reviewing how your chosen signals perform helps you spot fading indicators and adjust settings.
For example, adjusting moving average periods to fit current volatility or combining new momentum tools can boost accuracy. Traders who adapt usually stay ahead.
Managing risks around NAS100 signals isn’t about avoiding losses altogether — it’s about controlling impact, improving decision quality, and guarding your trading capital through thoughtful practices.
By steering clear of common pitfalls and practising sound risk management, you can navigate the NASDAQ 100 space with more confidence and fewer unpleasant surprises.
📉 Understand free margin in trading: how it affects your funds for new trades and losses. Learn to manage it wisely amidst volatile markets, tailored for South African traders.

🔍 Explore how synthetic indices mimic real markets with computer-generated data. Understand their risks, benefits, and get practical trading tips for smarter decisions.

📘 Understand direv with this practical guide covering its definition, uses, and real-life examples to help South Africans apply it confidently in daily and specialised contexts.

Explore synthetic trading 🛠️ to create positions mimicking others. Learn strategies, risks, and examples across assets for savvy trading decisions 📊.
Based on 13 reviews